
Welcome to this journey to learn JMeter! Before discussing JMeter, we will learn about what’s Performance Testing.
It is important to ensure the effective performance of software application and therefore, Software Testing is required to ensure that the application runs smoothly without any fiascos.
What is Performance Testing?
Performance Testing is a non-functional type of testing. It ensures software applications to perform well under their expected workload.
Attributes of Performance Testing:
- Speed– It checks the response time, rendering of data, and accessing.
- Scalability – It determines the maximum user load.
- Stability – It checks the stability of application under varying loads.
- Reliability– It determines whether the software product is secure or not.
JMeter Basics:
JMeter is an open-source, pure Java platform software that is designed to load test functional behavior and measure performance. It can perform load and performance tests on Web Pages, Web Applications and static or dynamic resources Like Database, Rest Webservices, LDAP, Java Objects and more.
How to Install JMeter –
- First of all, download JDK latest, and JMeter.
- Now install the prerequisites.
- Start the JMeter and follow the path.
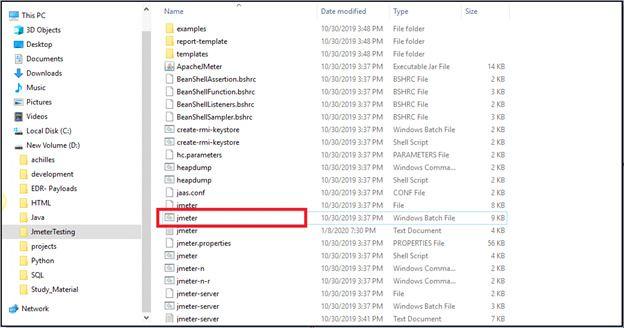
- JMeter > go to bin folder > Double click on JMeter batch file & wait for few seconds to launch the JMeter GUI.
Elements of JMeter:
JMeter consists of several components, known as Elements. These elements are designed in such a way that each one performs a specific task. Some of the main elements are:
- Thread Group
- Samplers
- Listeners
- Configuration
Thread Group
It is a collection of threads. These threads simulate how the user interacts with the application, how the load is maintained and over what period of time.
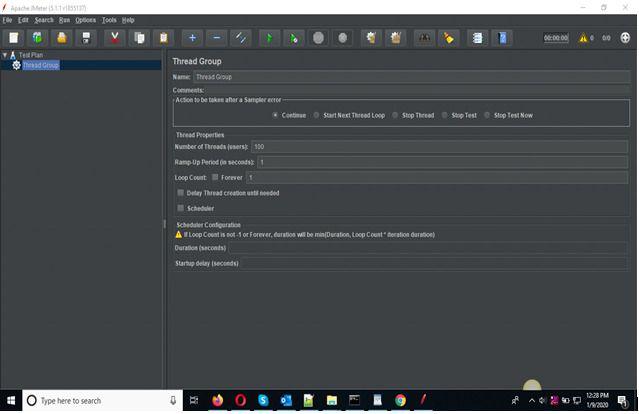
For example, if you set no. of threads 100, JMeter will create and simulate 100 user requests to the server under test.
Samplers
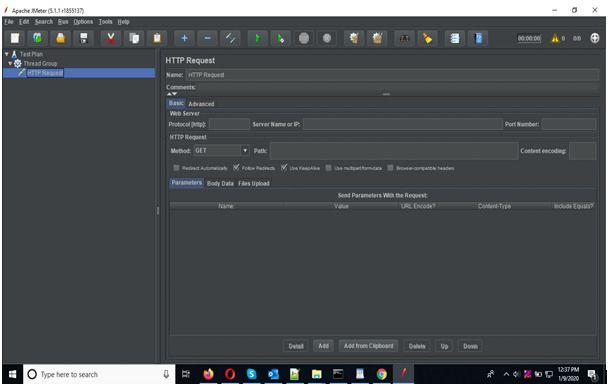
JMeter supports testing HTTP, FTP, JDBC, and many more protocols. Samplers help JMeter to send a request to the server and wait for the response. Each sampler generates one or more sample results.
- FTP request: An FTP request is made to do a performance test on the FTP server. Users can send an FTP ‘Download File’ or ‘Upload File’ to the FTP server.
- HTTP request: User can send an HTTP/HTTPS request to a web server.
- JDBC request: This sampler lets you execute Database Performance Testing. It sends a JDBC Request to a database.
- BSF Sampler: This sampler allows you to write a sampler using a BSF scripting language.
- Access Log Sampler: This sampler lets you read access logs and generate HTTP requests.
- SMTP Sampler: Used to send email messages using the SMTP protocol.
Listeners
Listener is a component that shows the results of the test execution. These results can be shown in various different formats such as a tree, table, graph or log file.
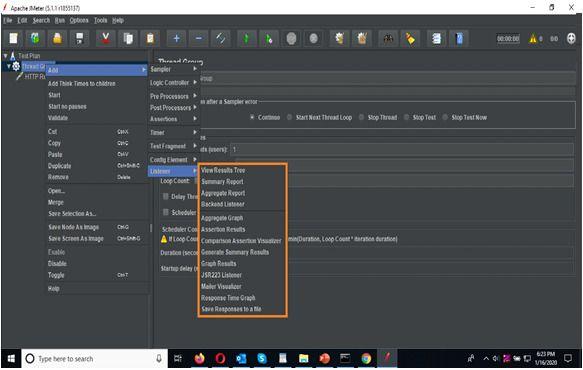
- Graph result listeners: It displays the server response time on a Graph.
- View Result Tree: It shows the result of the user request in basic HTML format.
- Table Result: It shows the summary of test results in the tabular format.
- Log: It shows the summary of test results in the text file.
Configuration Elements
These elements are used to set up the defaults and variables for later use by samplers.
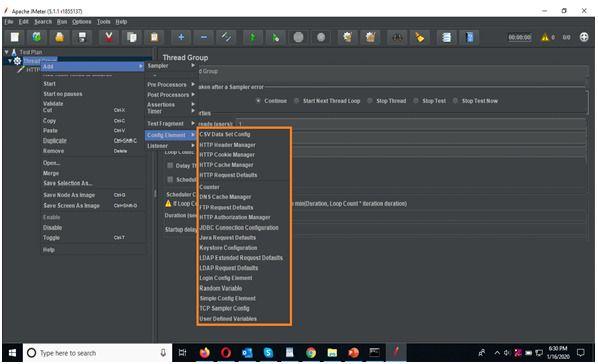
- CSV Data Set Config: It allows us to read different parameters from the text file. Also, we can read lines from the file, and split them into variables.
- HTTP Cookie Manager: It has the same feature as a web browser. If an HTTP Request has made and the response contains a cookie, the Cookie Manager automatically stores that cookie to use it for all future requests.
- HTTP request default: This element lets you set default values that your HTTP Request controllers use.
- Login Config Element: The Login Config Element lets you add or override username and password settings in samplers.
Conclusion:
As we discussed the JMeter performance, with the help of this open-source tool you can check the performance both on static and dynamic resources. It can be integrated with Bean Shell & Selenium for automated testing.Script Test.
I hope, this blog will help to better the performance testing results while using its element components & features in testing. You can also know that How to Create Maven Project in Eclipse for Selenium? for automation testing.
Feel free and ask me anything in the comment box related to “Test Performance Testing Using JMeter”, if you have some confusion.
Thanks for reading this blog!!
Share:
0
+0
Related Articles


November 12, 2026 . 5 min read